Elsevier’s SciVal is a research performance assessment tool with which you can analyze and visualize research performance on an institutional, departmental, researcher or research group level. SciVal includes the publication and citation data found in the database Scopus which includes over 22 000 institutions and their associated researchers from 234 nations. The data in SciVal is updated weekly and is usually 1-2 week behind Scopus.
To access SciVal, log in to University of Vaasa Finna with your HAKA username, go to Browse databases under Search functions and choose SciVal from the list. You can access SciVal with the same username and password used in other Elsevier products like Scopus, ScienceDirect and Mendeley. If you do not have a username yet, do not click ”Sign in via your institution” in SciVal but create an account.
By using the data available in Scopus, you can evaluate the quality and impact of your research project and can easily monitor the progress while the project is still on-going. SciVal can also be useful when looking for new research topics because you can map out the subject areas in which publications have in general been emerging lately. Furthermore, the data can give insight to where to publish and which top researchers to possibly reach out to. SciVal is a great tool for evaluating research performance, but one must take into consideration that not all publications can be found in Scopus, especially those written in Finnish.
When you create a research group in SciVal, you can concentrate on the publications of the members of that group. You can examine many different metrics, such as scholarly output, citations per publication, field-weighted citation impact, publications in the top journal percentiles and views count in Scopus to name a few. In addition, you can benchmark the group’s performance to other similar projects by focusing on various indicators. You can analyze existing collaboration or identify potential partners for future research projects. Instead of your research group, you can examine these same metrics regarding whole countries, institutions or individual researchers.
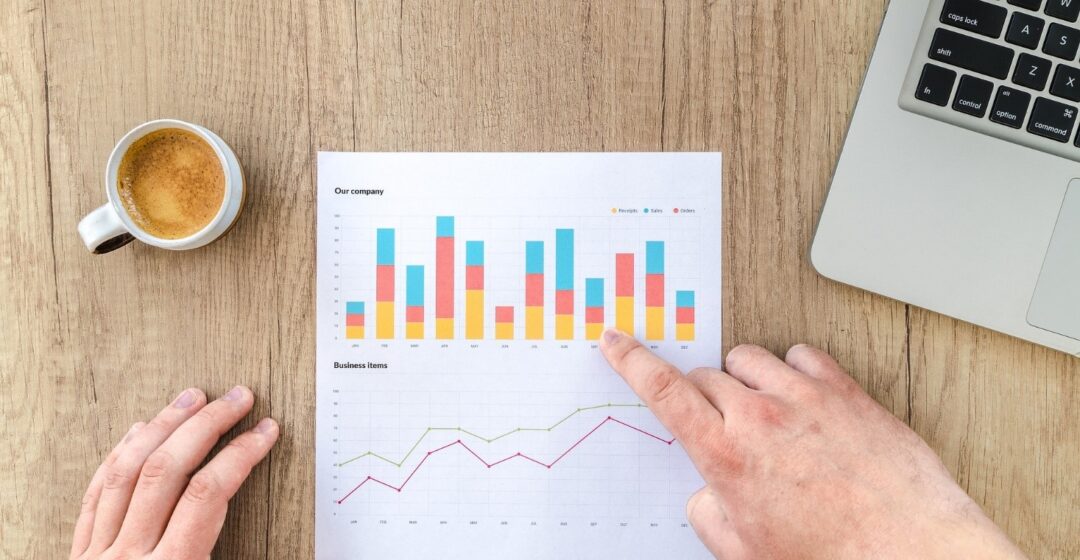
All the different indicators and analyses available in SciVal can be presented in different ways, such as tables or colorful bar, line or pie charts. You can generate visually pleasing reports to present your research group’s performance to, for example, funders. You can add further explanations below the charts and omit text you do not want to include. The final report can then be exported as a PDF file or a Word document. You can also save report templates to be used again later or share them with other SciVal users.
Elsevier’s SciVal is, of course, most beneficial for a research project when the researchers’ publications can be found in Scopus. Even if that is not the case, SciVal still provides plenty of interesting data about popular research areas and the research performance of various countries, institutions and researchers.
For a more thorough tutorial on SciVal, you can contact me at niina.sorvari@uwasa.fi! Or you find tutorial from messi.
Niina Sorvari
information specialist
Tritonia, University of Vaasa